SIEBERT TRADING PLATFORM REDESIGN
A 60% faster way to trade.
I redesigned Siebert's individual brokerage and stock plan portal — simplifying the trade flow, exercise flow, and account switching.
ROLE
Sole UX Designer
TIMELINE
3 months 2025
PLATFORM
Web, Tablet, Mobile
STATUS
Shipped, in production
01
The Challenge
Turning an open-ended redesign request into a focused UX direction
Siebert came to me with a broad ask: make the trading platform feel modern. That's the kind of brief that can spiral. Before I touched a pixel, I needed to find the actual friction — the moments where investors hesitate, click the wrong thing, or give up.
02
RESEARCH
To get started, I analysed their existing platforms
I sat with the existing platforms for a week, walking through every flow as if I were a first-time user. I logged each moment of confusion, then mapped them onto the screens.
I narrowed the scope to three workflows that came up in nearly every internal conversation: the trade flow, the stock plan exercise flow, and the way users have to constantly switch between brokerage and employer-stock accounts.
Information overload
Every feature shown at once — nothing prioritized.
No visual hierarchy
Headers, body, data all competed for the same attention.
Hidden core actions
Trade & view holdings, the two main actions, weren’t front-and-center.
Constant account switching
Consolidated data of brokerage and employee stock plan account unavailable
Doesn’t match mental models
Users couldn’t remember where things lived, so they constantly relied on search.
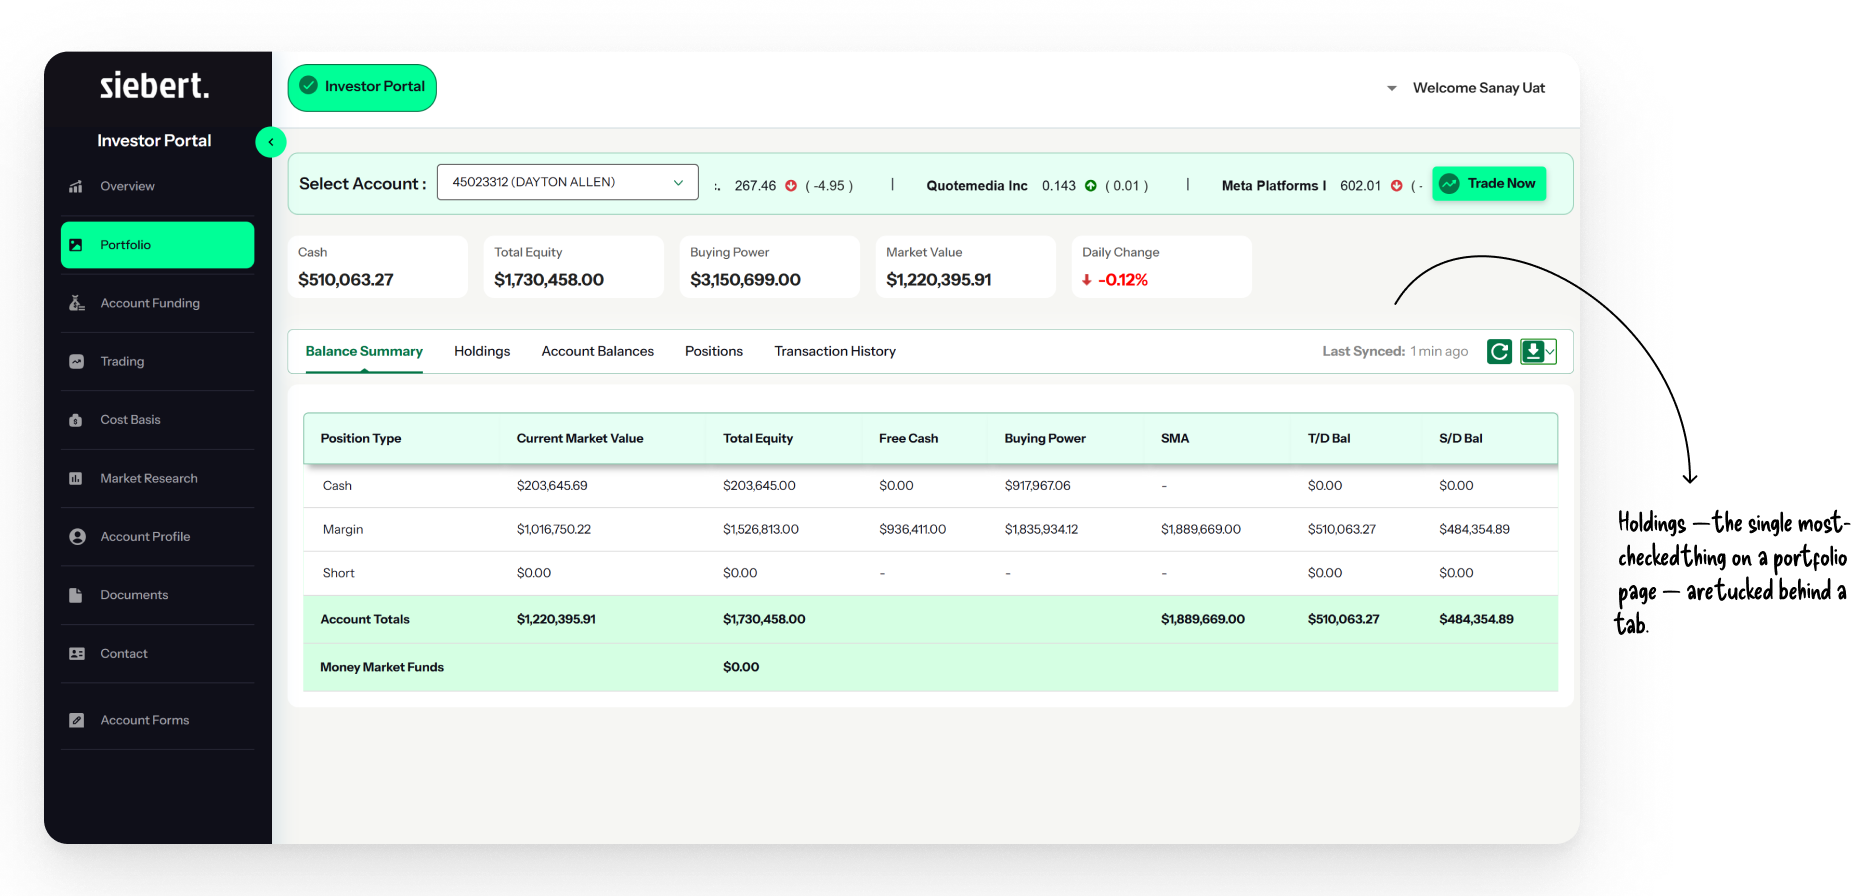
Before: Portfolio Page


03
GOALS OF THE REDESIGN
Three commitments I made before drawing anything
01
Clarity over density
Surface what investors check 80% of the time. Hide the rest behind clear progressive disclosure.

02
One predictable trade flow
A single shape for buying, selling, and exercising — so the muscle memory carries across products.
03
Consolidate account views
Bring investor and employee stock plan information into one clear dashboard without overwhelming users.
BEHIND THE SCENES
How AI sped up my exploration.
I used Stitch to generate dozens of layout directions in a day, then Figma Make to turn the chosen one into mid-fidelity clickable prototypes I tested with users mid-week.
04
The Solutions
What changed, and why.
I designed the new platform around four shifts. Each one came directly from a pain point I'd flagged in research — and each one was tested with real Siebert investors.
solUTION 01
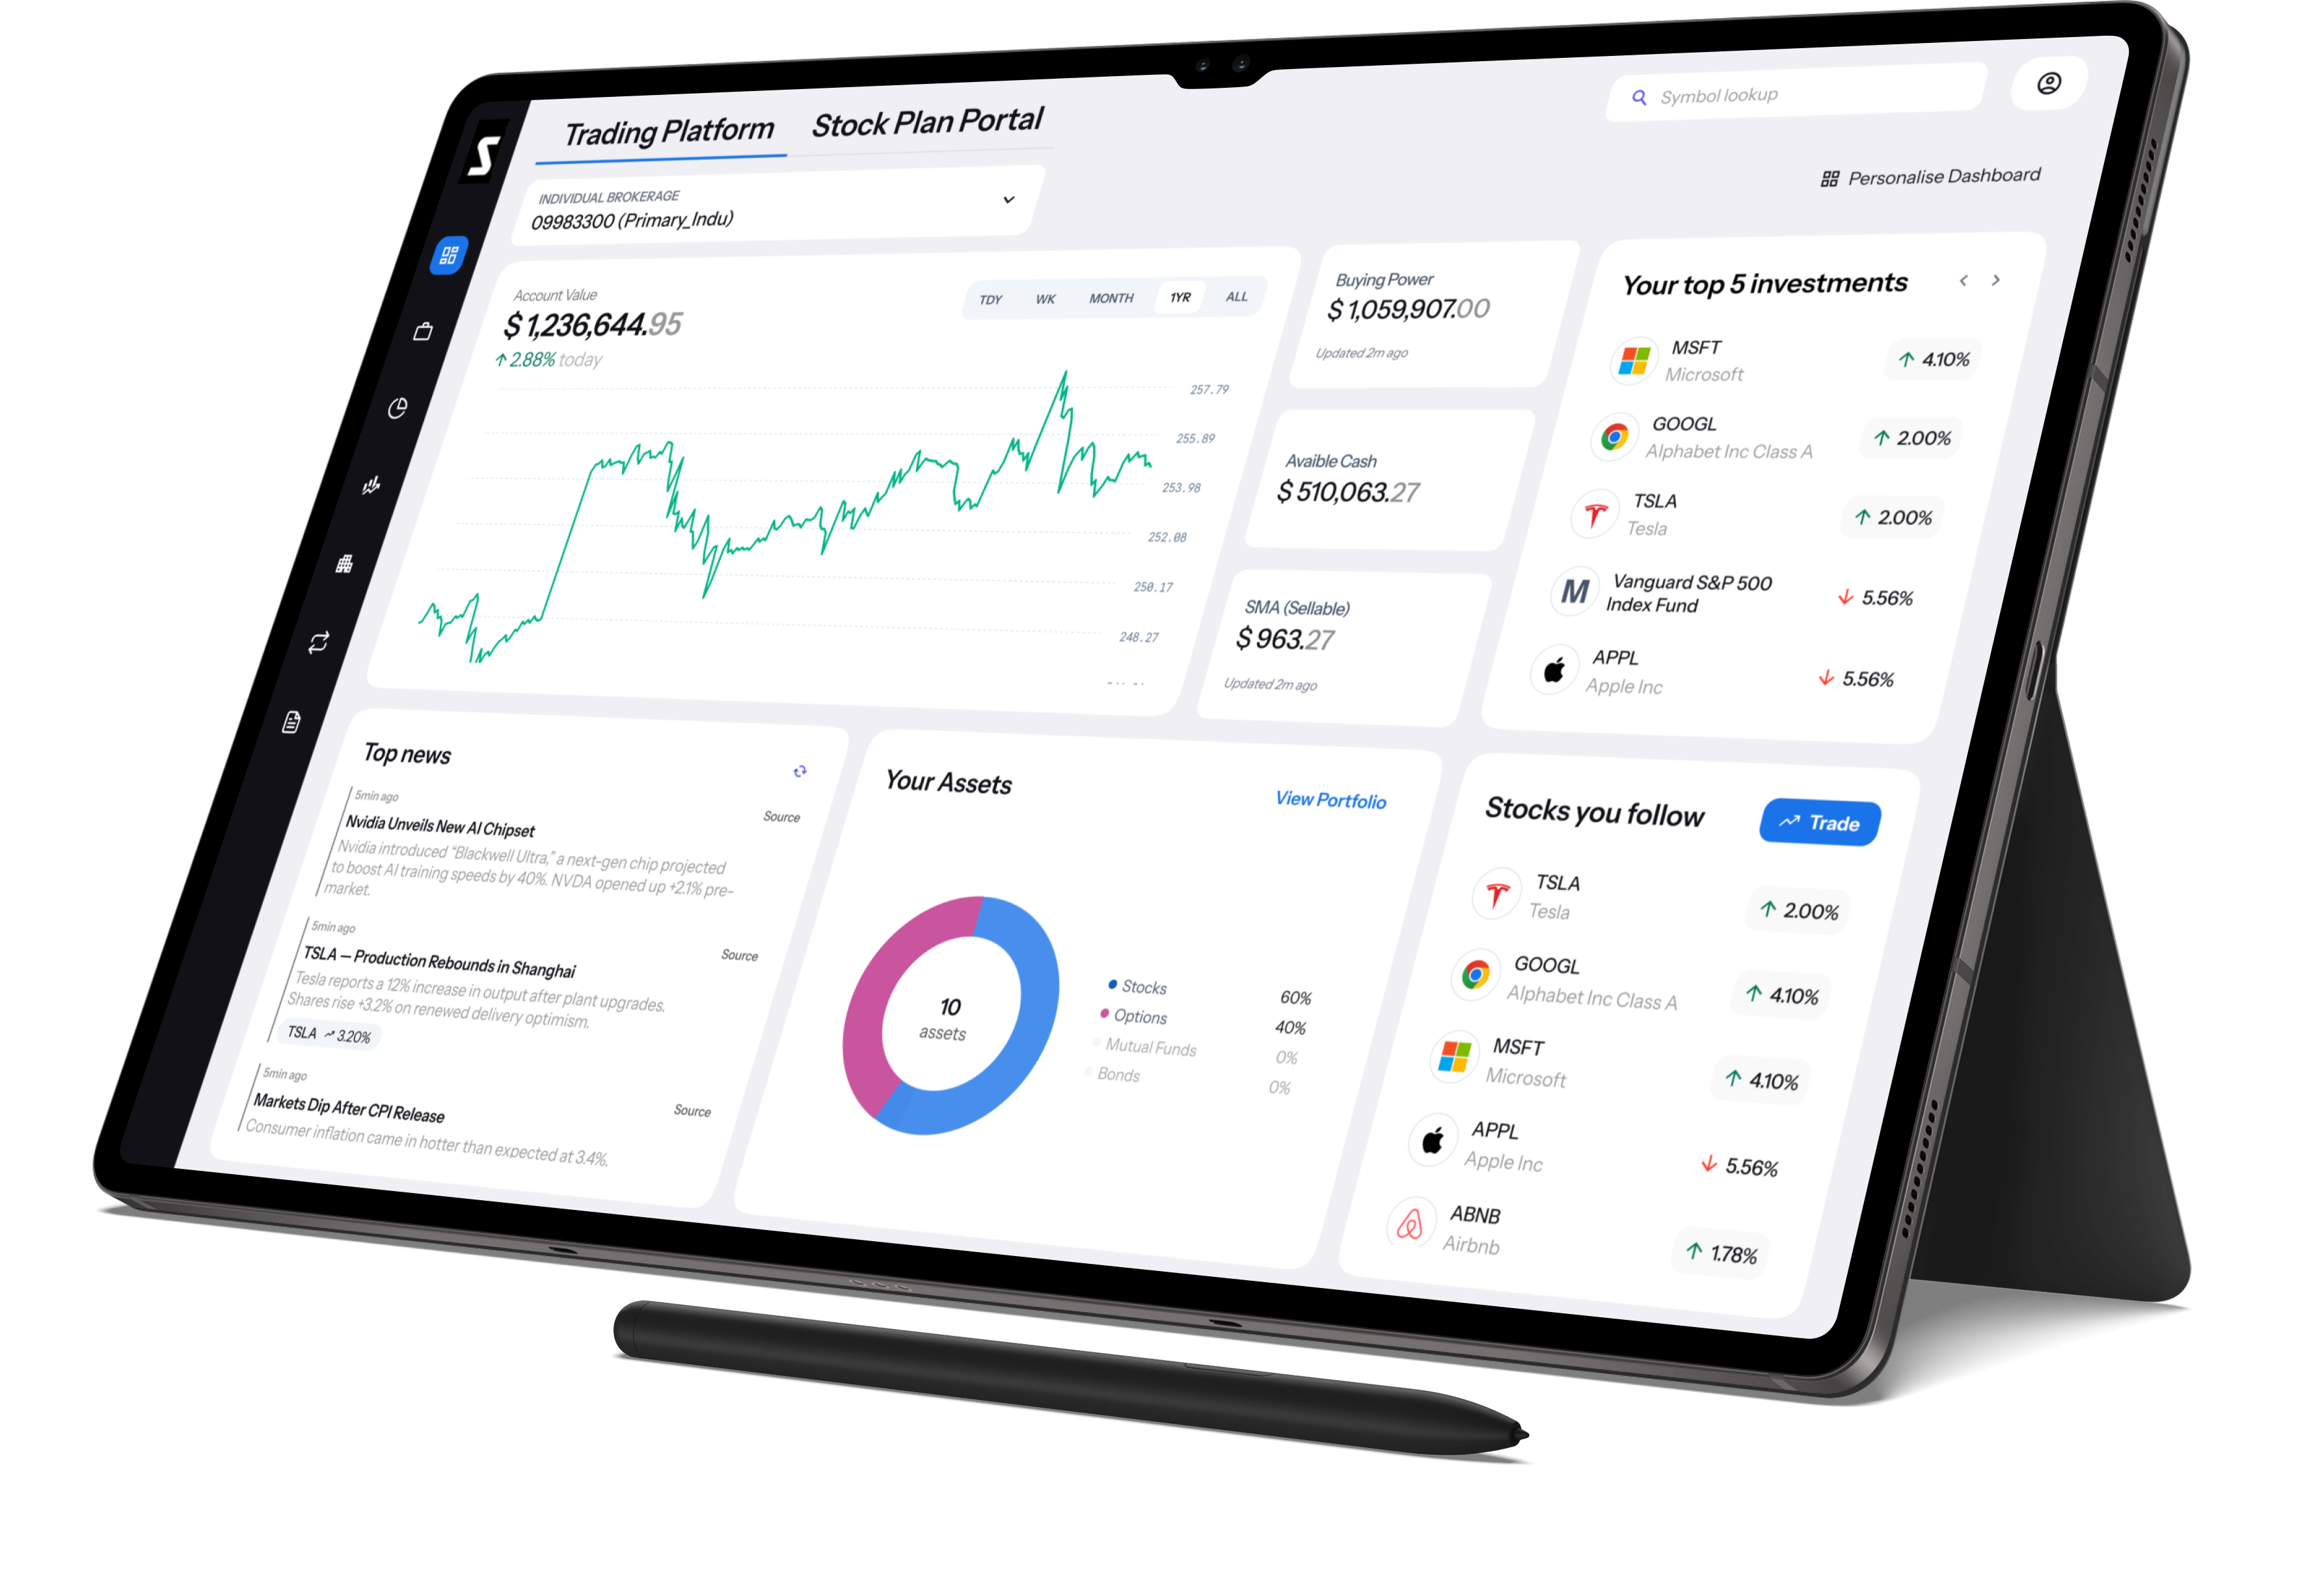
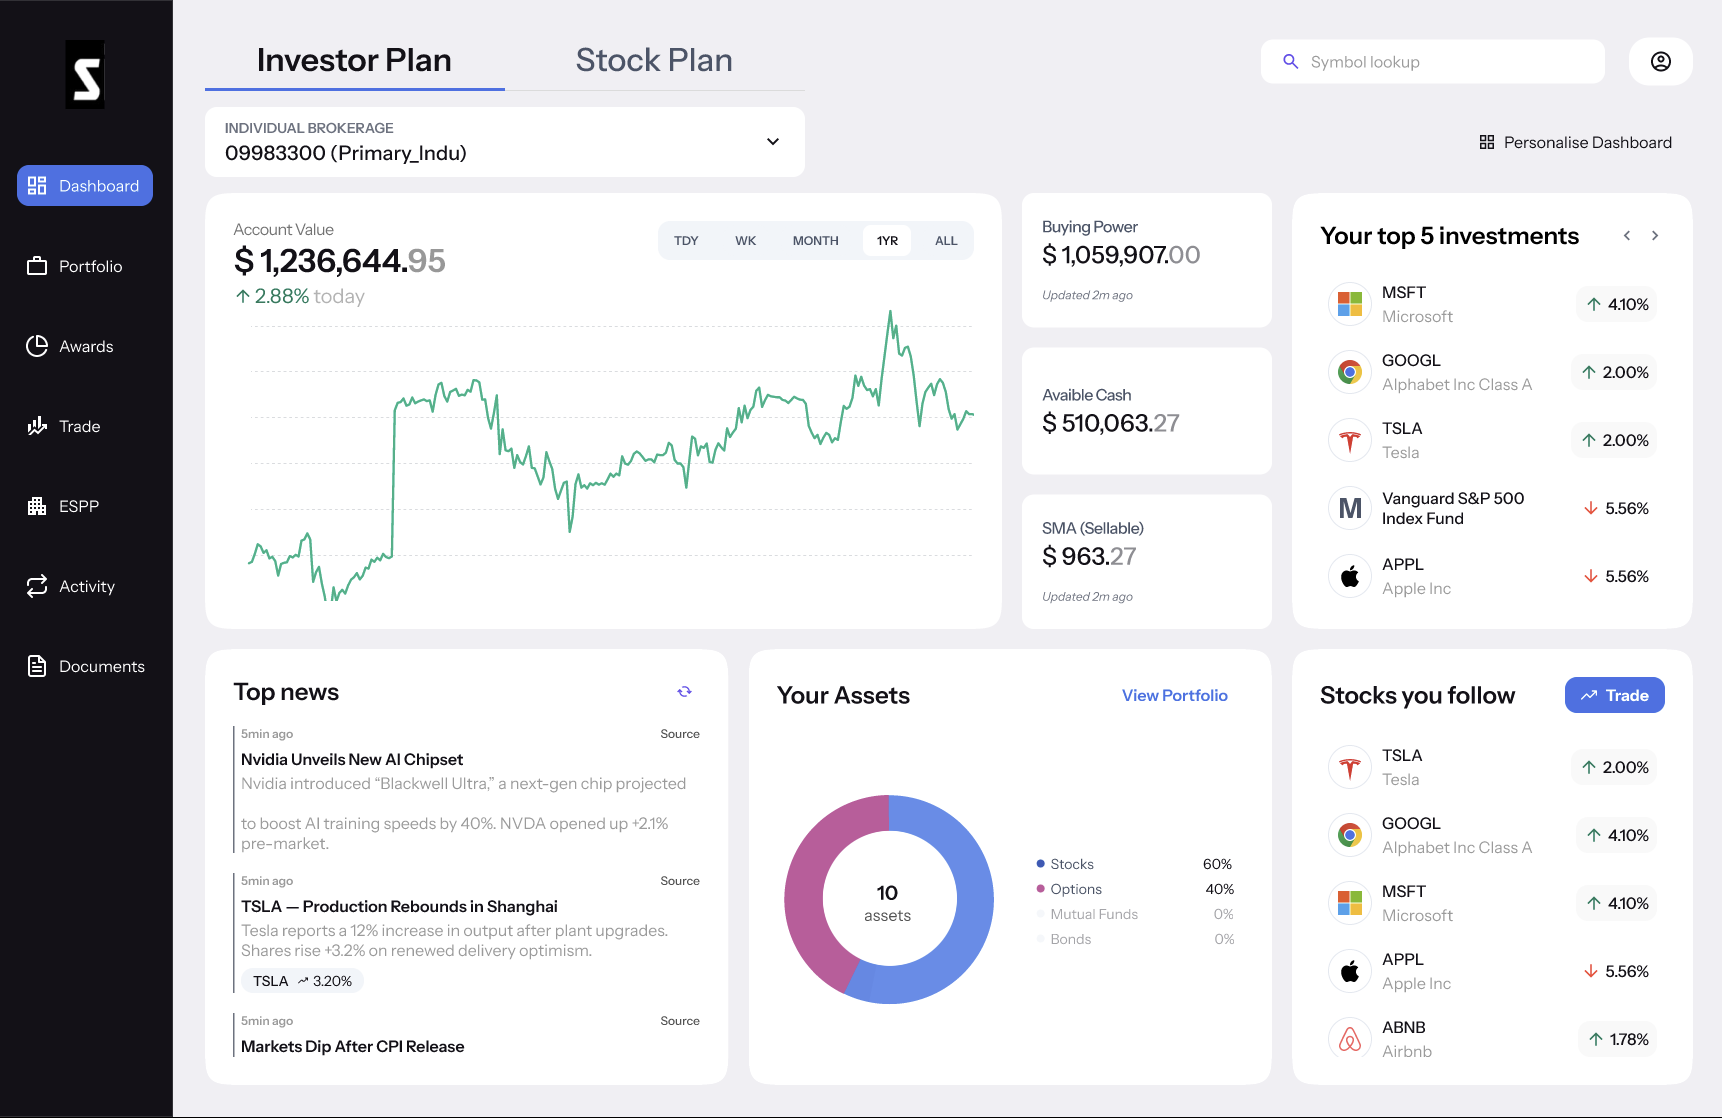
A dashboard that answers the first question first.
The most-asked question is 'what's my account worth right now?' I gave it the biggest type and the most space. After prioritizing account value, I added the next layer of information users often look for: their top investments and portfolio health, the stocks they follow, and relevant news. When a news story is connected to a company, users can move straight from that story to the stock detail page.
solUTION 02
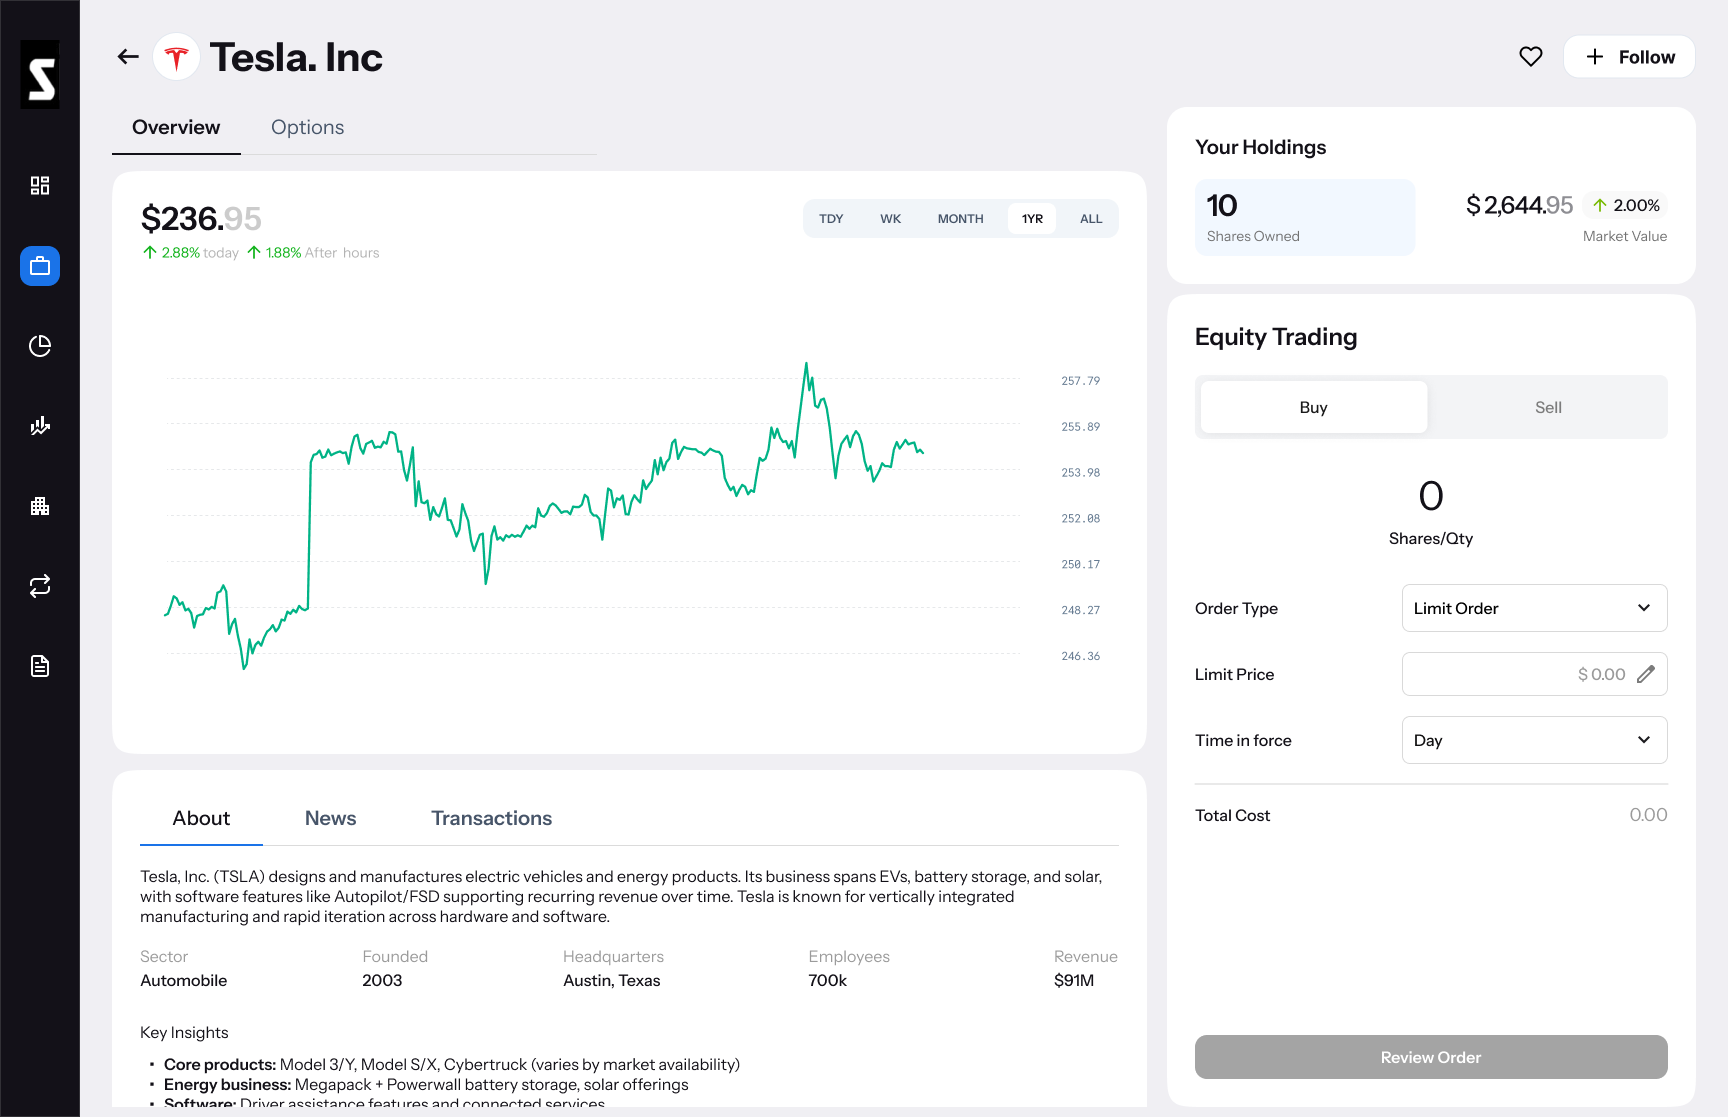
A trade flow that fits on one screen.
solUTION 03
An exercise flow a first-timer can finish without help.
Stock-plan participants (mostly first-time exercisers) told me the old flow felt like a quiz. Field labels assumed you already knew the difference between cashless, cash, and sell-to-cover. I rewrote each step in plain language, added a one-line preview of the tax outcome, and made the default option the one most beginners actually pick.
Cashless Exercise Prototype
solUTION 04
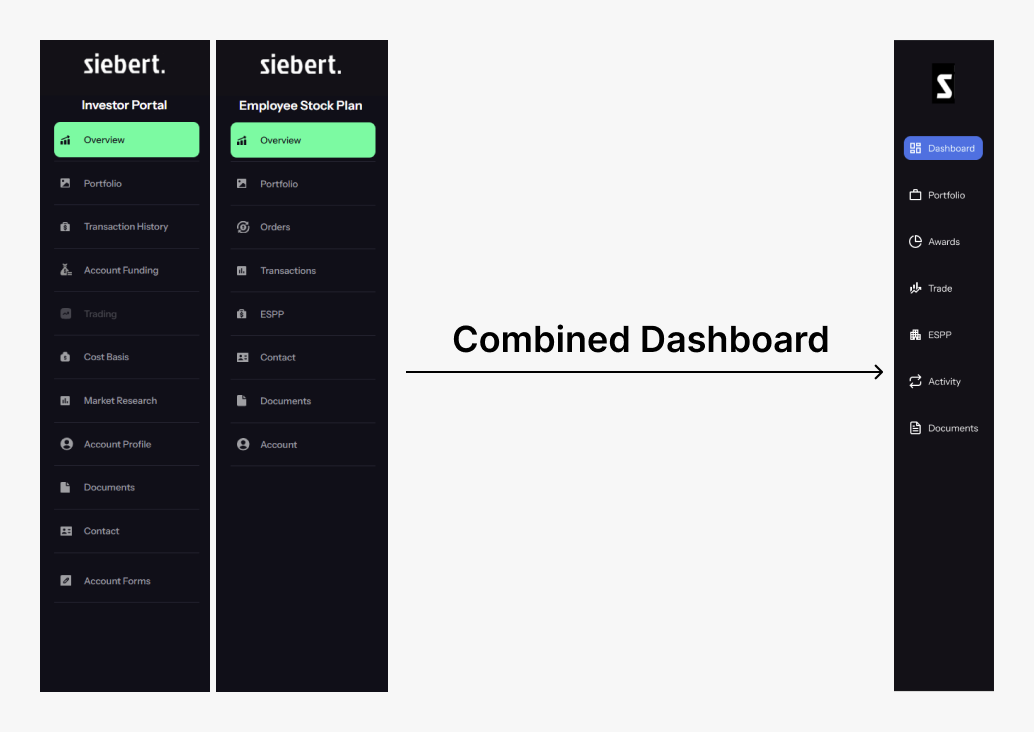
Consolidated Navigation to reduce account switching
The dashboard page has a split view allowing users to see both dashboards easily, keeping navigation constant and increasing user’s mental model of the platform. In activity, documents and account funding, users can see combined information of both account types - Brokerage and Stock Plan
06
OUTCOMES
The numbers I'm proud of.
I ran moderated tests with 8 Siebert customers across both account types — half Siebert employees who talk to clients, half active traders — and timed them through the same five tasks on the old and new platforms.
Reduction in time-on-task for the trade flow
measured in moderated user testing
Increase in successful navigation to deep features
tax docs, transfers, and exercise history
8 of 8 testers finished the exercise flow unassisted
up from 3 of 8 on the old flow
Better recall of where key sections live
unmoderated retention test, 48 hours after first use
06
REFLECTIONS
What I took away
DOMAIN
Clarity over density
Trading workflows are full of regulatory edges, edge-case account states, and tax consequences. I learned to slow down, ask "what happens when X is true?" before sketching, and treat the financial advisor as an essential reviewer — not just an engineer hand-off.
PROCESS
AI tools widened my exploration.
I used Stitch to spin up wildly different layout options in minutes, and ChatGPT to map workflow edge cases before committing to a flow. They didn't replace decisions — they let me reach more decisions per day.
SIEBERT TRADING PLATFORM REDESIGN
A 60% faster way to trade.
I redesigned Siebert's individual brokerage and stock plan portal — simplifying the trade flow, exercise flow, and account switching.
ROLE
Sole UX Designer
TIMELINE
3 months 2025
PLATFORM
Web, Tablet, Mobile
STATUS
Shipped, in production
01
The Challenge
Turning an open-ended redesign request into a focused UX direction
Siebert came to me with a broad ask: make the trading platform feel modern. That's the kind of brief that can spiral. Before I touched a pixel, I needed to find the actual friction — the moments where investors hesitate, click the wrong thing, or give up.
02
RESEARCH
To get started, I analysed their existing platforms
I sat with the existing platforms for a week, walking through every flow as if I were a first-time user. I logged each moment of confusion, then mapped them onto the screens.
I narrowed the scope to three workflows that came up in nearly every internal conversation: the trade flow, the stock plan exercise flow, and the way users have to constantly switch between brokerage and employer-stock accounts.
Information overload
Every feature shown at once — nothing prioritized.
No visual hierarchy
Headers, body, data all competed for the same attention.
Hidden core actions
Trade & view holdings, the two main actions, weren’t front-and-center.
Constant account switching
Consolidated data of brokerage and employee stock plan account unavailable
Doesn’t match mental models
Users couldn’t remember where things lived, so they constantly relied on search.
Before: Portfolio Page
03
GOALS OF THE REDESIGN
Three commitments I made before drawing anything
01
Clarity over density
Surface what investors check 80% of the time. Hide the rest behind clear progressive disclosure.

02
One predictable trade flow
A single shape for buying, selling, and exercising — so the muscle memory carries across products.
03
Consolidate account views
Bring investor and employee stock plan information into one clear dashboard without overwhelming users.
BEHIND THE SCENES
How AI sped up my exploration.
I used Stitch to generate dozens of layout directions in a day, then Figma Make to turn the chosen one into mid-fidelity clickable prototypes I tested with users mid-week.
04
The Solutions
What changed, and why.
I designed the new platform around four shifts. Each one came directly from a pain point I'd flagged in research — and each one was tested with real Siebert investors.
solUTION 01
A dashboard that answers the first question first.
The most-asked question is 'what's my account worth right now?' I gave it the biggest type and the most space. After prioritizing account value, I added the next layer of information users often look for: their top investments and portfolio health, the stocks they follow, and relevant news. When a news story is connected to a company, users can move straight from that story to the stock detail page.
solUTION 02
A trade flow that fits on one screen.
The old trade flow walked users through 6 separate steps across modal-heavy screens. I collapsed it to 4: pick the symbol, choose order type, confirm. Validation happens inline; the confirm step is the only thing that ever pulls focus.
solUTION 03
An exercise flow a first-timer can finish without help.
Stock-plan participants (mostly first-time exercisers) told me the old flow felt like a quiz. Field labels assumed you already knew the difference between cashless, cash, and sell-to-cover. I rewrote each step in plain language, added a one-line preview of the tax outcome, and made the default option the one most beginners actually pick.
Cashless Exercise Prototype
solUTION 04
Consolidated Navigation to reduce account switching
The dashboard page has a split view allowing users to see both dashboards easily, keeping navigation constant and increasing user’s mental model of the platform. In activity, documents and account funding, users can see combined information of both account types - Brokerage and Stock Plan
06
OUTCOMES
The numbers I'm proud of.
I ran moderated tests with 8 Siebert customers across both account types — half Siebert employees who talk to clients, half active traders — and timed them through the same five tasks on the old and new platforms.
Reduction in time-on-task for the trade flow
measured in moderated user testing
Increase in successful navigation to deep features
tax docs, transfers, and exercise history
8 of 8 testers finished the exercise flow unassisted
up from 3 of 8 on the old flow
Better recall of where key sections live
unmoderated retention test, 48 hours after first use
06
REFLECTIONS
What I took away
DOMAIN
Fintech rewarded patience.
Trading workflows are full of regulatory edges, edge-case account states, and tax consequences. I learned to slow down, ask "what happens when X is true?" before sketching, and treat the financial advisor as an essential reviewer — not just an engineer hand-off.
PROCESS
AI tools widened my exploration.
I used Stitch to spin up wildly different layout options in minutes, and ChatGPT to map workflow edge cases before committing to a flow. They didn't replace decisions — they let me reach more decisions per day.